By Sang Lee — Founder and Editor of AssetCalculus
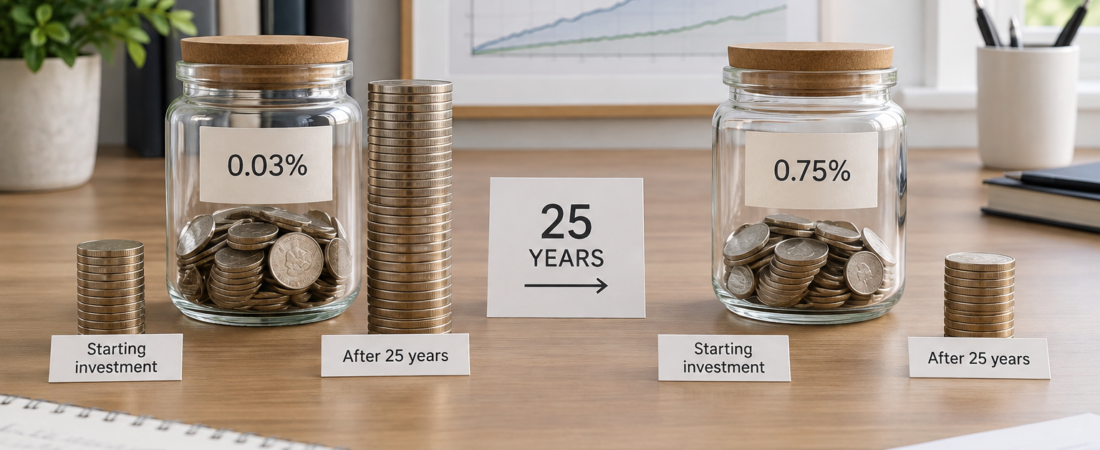
Quick answer: If two comparable funds both earn 7% before fees, a $10,000 investment held for 25 years grows to about $53,895.18 with a 0.03% expense ratio and $45,522.22 with a 0.75% expense ratio. The difference is approximately $8,372.95.
A 0.72-percentage-point fee gap looks small in one year. Over decades, the direct fee and the growth that money could have earned compound together.
The Long-Term Comparison
| Expense ratio | Net assumed return | 10 years | 25 years |
|---|---|---|---|
| 0.03% | 6.97% | $19,620.46 | $53,895.18 |
| 0.75% | 6.25% | $18,340.04 | $45,522.22 |
| Difference | 0.72 points | $1,280.42 | $8,372.95 |
The example assumes one initial investment, constant returns and fees, no taxes, and no additional deposits. Actual fund returns vary.
How Much Is 0.75% Per Year?
At a constant $10,000 balance, 0.75% corresponds to $75 per year. A 0.03% fee corresponds to $3. But the account balance changes, so the dollar expense also changes. The long-term cost is not simply $72 multiplied by 25 years.
Why the Compounding Cost Is Larger
Expenses reduce the amount left in the fund. The removed money cannot participate in future growth. Under the simplified model:
Net return = Gross return − Expense ratio
Future value = Starting balance × (1 + net return)years
Fee Comparison by Holding Period
| Holding period | 0.03% fund | 0.75% fund | Difference |
|---|---|---|---|
| 1 year | $10,697.00 | $10,625.00 | $72.00 |
| 5 years | $14,005.52 | $13,540.81 | $464.71 |
| 10 years | $19,620.46 | $18,340.04 | $1,280.42 |
| 25 years | $53,895.18 | $45,522.22 | $8,372.95 |
When a Higher Fee May Reflect a Different Product
A higher-cost fund is not automatically interchangeable with a low-cost index ETF. It may follow another strategy, hold different assets, provide active management, hedge currencies, or operate in a specialized market. Compare fees only after confirming the funds have sufficiently similar objectives, risks, holdings, and tax characteristics.
Other Costs to Compare
- Bid-ask spread
- Brokerage commissions
- Premium or discount to net asset value
- Tracking difference
- Portfolio turnover and tax efficiency
- Advisory or platform fees
A Fair Decision Process
- Identify funds with the same objective or benchmark.
- Read the current prospectus and shareholder information.
- Compare expense ratios and tracking results.
- Estimate the dollar impact using your balance and holding period.
- Review spreads, liquidity, taxes, and risk.
- Do not switch solely because of one fee number without considering transaction and tax consequences.
Use the Calculator
Test your own balance, gross return, fees, and time period with the ETF Expense Ratio Impact Calculator. For a broader contribution model, use the Compound Interest Calculator.
Frequently Asked Questions
Is the expense ratio charged as a bill?
Usually not. Fund operating expenses are paid from fund assets and reflected in performance.
Does the lower-fee fund always win?
No. The calculator isolates cost by assuming equal gross returns. Real holdings and results may differ.
Can the expense ratio change?
Yes. Confirm the current figure in the latest fund documents.
Bottom Line
With identical 7% gross returns, reducing the expense ratio from 0.75% to 0.03% leaves about $8,372.95 more after 25 years on a $10,000 starting balance. Cost matters, but compare genuinely similar funds and include other expenses and tax consequences.
Official Resources
Educational purposes only. Results are hypothetical and do not recommend a particular fund.